
For the fourth month running, Seattle’s year-over-year percentage increase on the May 2020 S&P CoreLogic Case-Shiller Home Price Index trailed only that of Phoenix among the nation’s leading cities. The dollar value of Seattle’s residential index gains outperformed even Phoenix’s residential price growth. Regional home selling data from subsequent months, recorded by the Northwest Multiple Listings Service (NWMLS), show that May was the peak months of impacts from the COVID-19 virus and public health measures ordered by Washington Governor Jay Inslee. In that month, there were 34.5 percent fewer residential transactions in the Seattle metropolitan statistical area (“Seattle MSA,” comprising King, Snohomish, and Pierce Counties) than the May average among the preceding three years. Yet as we will describe toward the end of this report, on behalf of their clients, Realogics Sotheby’s International Realty (RSIR) brokers closed more residential sales monthly in July than in any month in the firm’s history. We will also describe how some residential selling prices were bid up by buyers, although not with the frequency seen two or three years before.
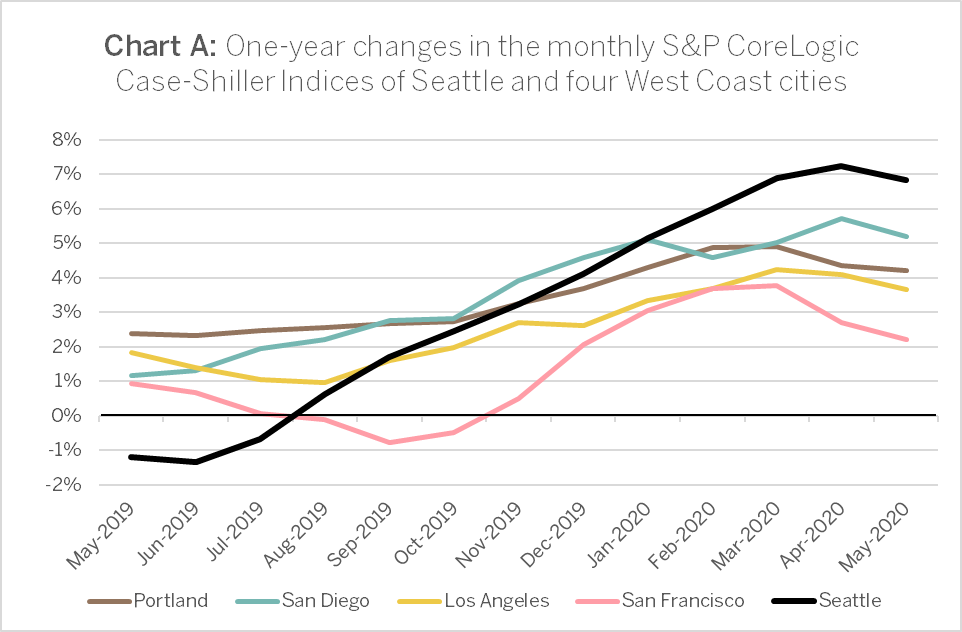
The CoreLogic Case-Shiller Home Price Index[1] results published by S&P Dow Jones on July 28 showed a 12-month index increase of 6.8 percent for the Seattle MSA, compared with 9.0-percent growth for Phoenix over the same period. Along the Pacific Coast, all five cities indexed by Case Shiller saw slightly slower rates of increase in May. Not only is this seasonally typical and consistent with results in prior years, but the difference does not appear to have been aggravated by the current economic conditions or restrictions related to COVID-19. The April-to-May changes were from 7.2 percent to 6.8 percent in Seattle; 5.7 percent to 5.2 percent in San Diego; 4.4 percent to 4.2 percent in Portland, Oregon; 4.1 percent to 3.7 percent in L.A.; and 2.7 percent to 2.2 percent in San Francisco.

Craig J. Lazzara, Managing Director and Global Head of Index Investment Strategy at S&P Dow Jones Indices, reported “stable” prices in May. “The National Composite Index rose by 4.5% in May 2020, with comparable growth in the 10- and 20-City Composites (up 3.1% and 3.7%, respectively). In contrast with the past eight months, May’s gains were less than April’s. Although prices increased in May, in other words, they did so at a decelerating rate. We observed an analogous development at the city level: prices increased in all 19 cities for which we have data, but accelerated in only three of them (in contrast with 12 cities last month and 18 the month before that) … Even if prices continue to decelerate, that is quite different from an environment in which prices actually decline.”[2]
Buyer competition shadows late twenty-teen markets
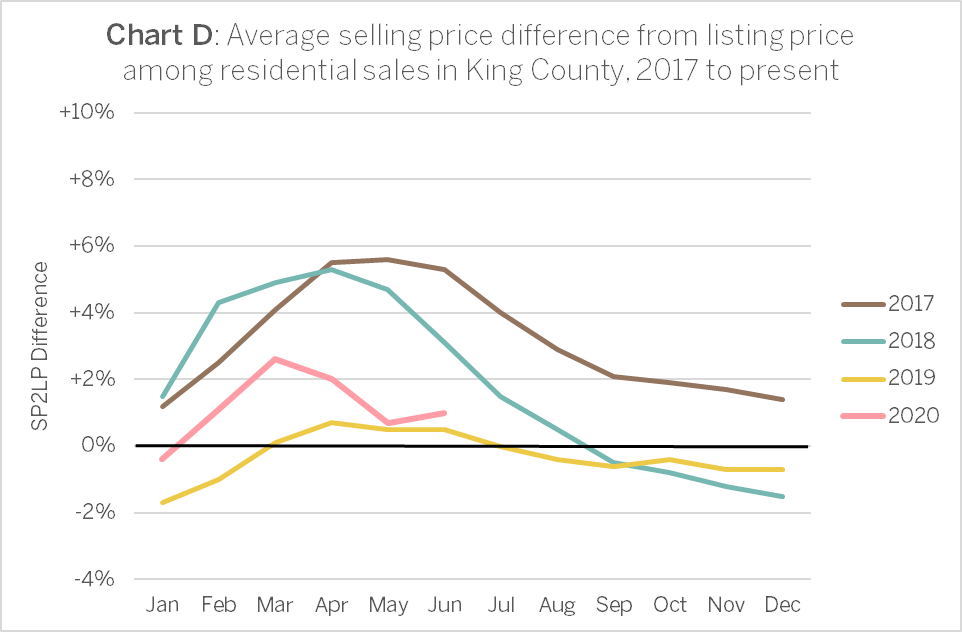
Two months ago, it might have seemed that under COVID-19 restrictions, a few fortunate buyers would ride a wave of sales under urgent and possibly distressed conditions for sellers. That scenario has not yet materialized, as there have been more than enough buyers to sustain prices and even drive them higher. Notably, any competition among buyers has not generally resulted in the degree of upward deviations of selling prices that were seen in 2017 and mid-2018, as can be seen in Charts C through F below.


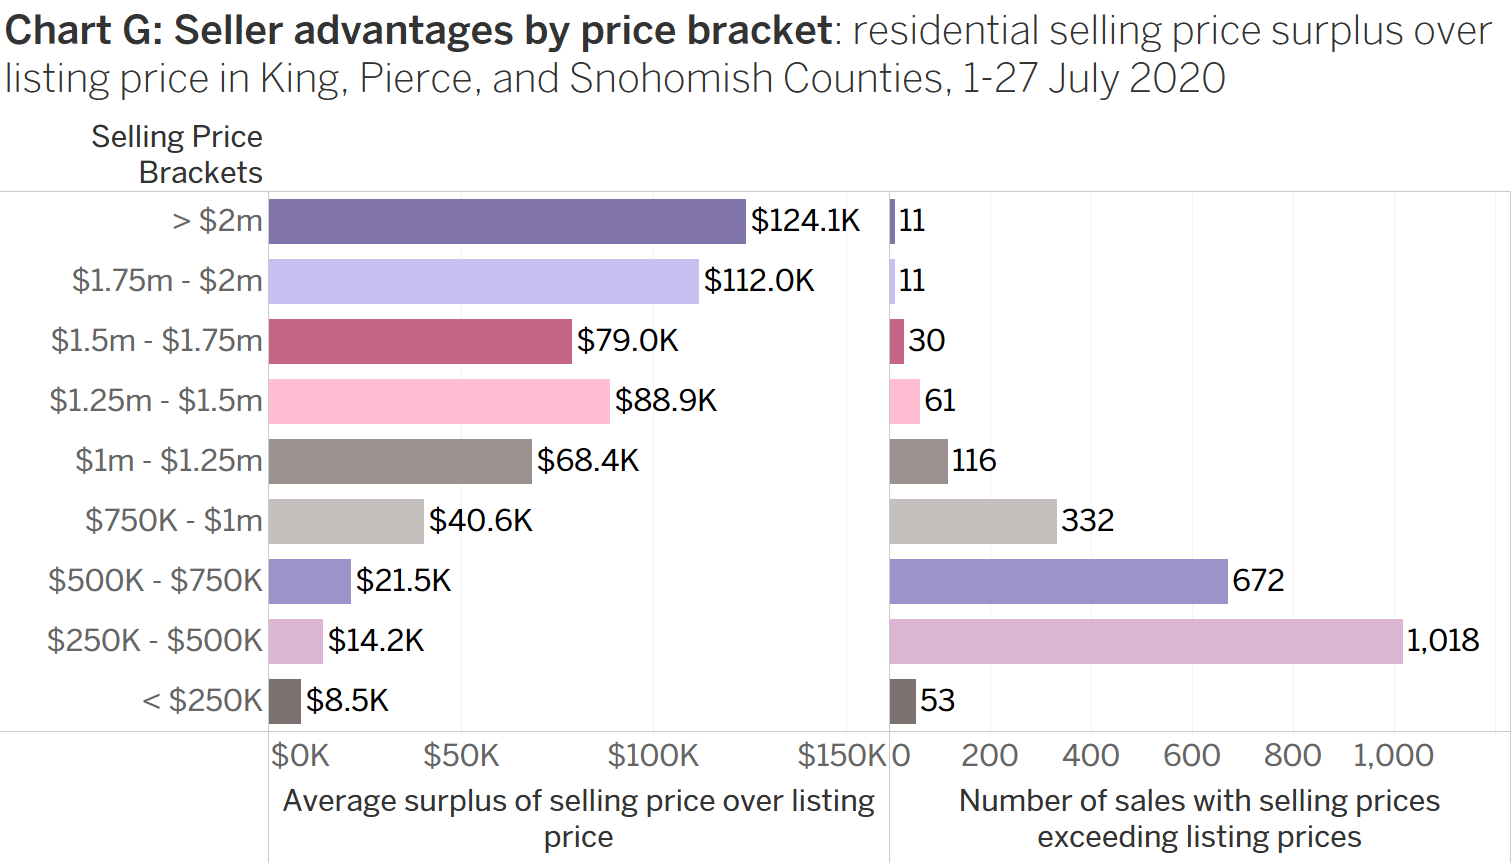
Yet within the Seattle MSA, there were price brackets and a few areas that saw substantial numbers of transactions close at prices higher than the seller’s ask. At entry-level price ranges, over a thousand homes were sold for more than the seller’s listing price in July.
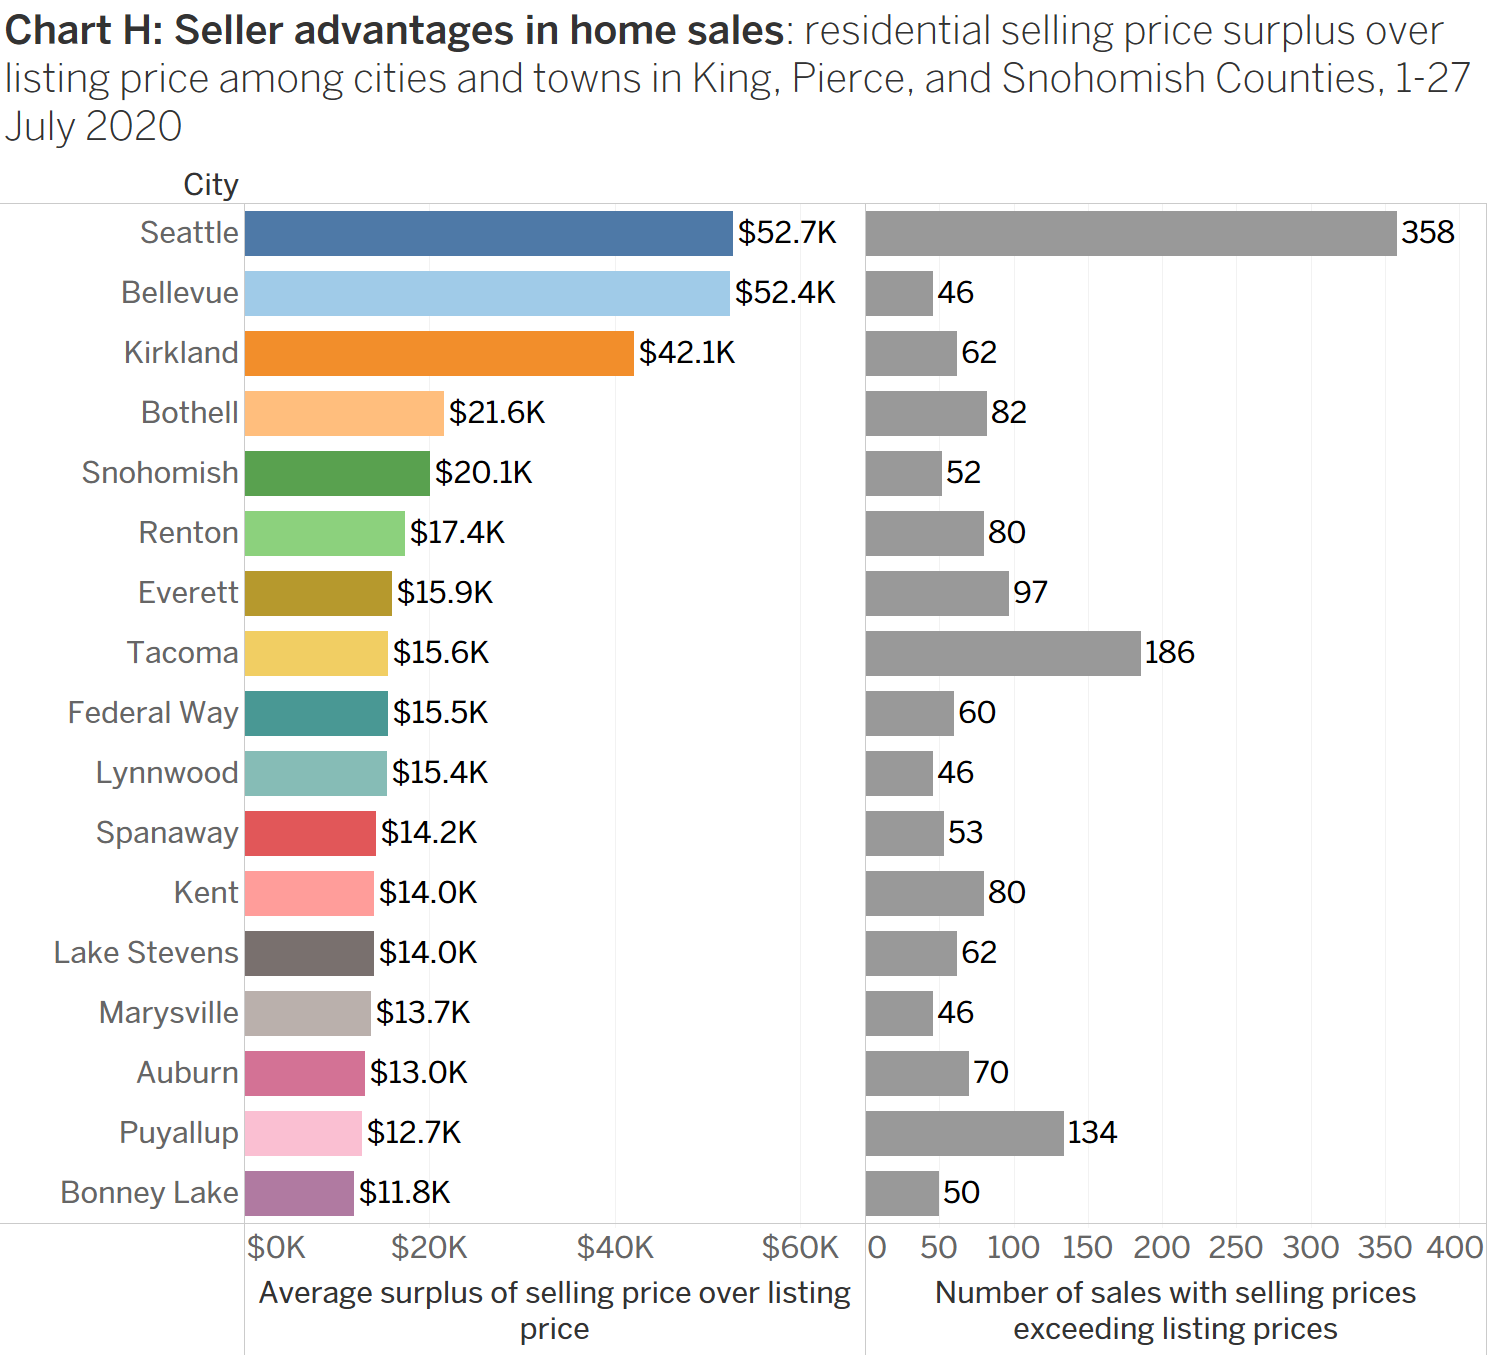
Also in that month, cities and towns at the edge of inbound commutes to employment centers saw outsized portions of these bid-up sales. These areas included Puyallup and Kent in the south, and Everett and Lake Stevens in the north. Prime markets at the center of the region also continued to see some competitive bidding, although at lesser proportions than in previous years.
RSIR sees record month for closing client sales
Different brokers and their clients are experiencing these extraordinary times in very different ways. This year in the Seattle MSA, the monthly numbers of residential homes sold have declined every month from their same month averages of the past three years. Yet May was the only month since January in which the matching numbers of residential sales closed by RSIR brokers were lower. In March, RSIR residential closings were double the firm’s three-year monthly average for the Seattle MSA. Among all residential sales in the region, June closings matched the monthly firm record of 69 set a year before; and there were 72 sales in the first 30 days of July. This puts July 2020 on track to be RSIR’s top month for residential sales in the firm’s history.
For more details on the May 2020 Case-Shiller Index results, download the S&P Dow Jones Case-Shiller summary report. For details on the market implications of our reports for homes in your neighborhood, contact a local RSIR broker.
[1] Published by S&P Dow Jones, the Case Shiller Index surveys resales of residential homes in the Seattle MSA. The index notably does not account for condominium sales.
[2] “S&P CoreLogic Case-Shiller Index Reports 4.5% Annual Home Price Gain in May,” S&P Dow Jones, New York, 28 July 2020.